
Visualization dashboard of financial consumer complaints
2024, Mar 12
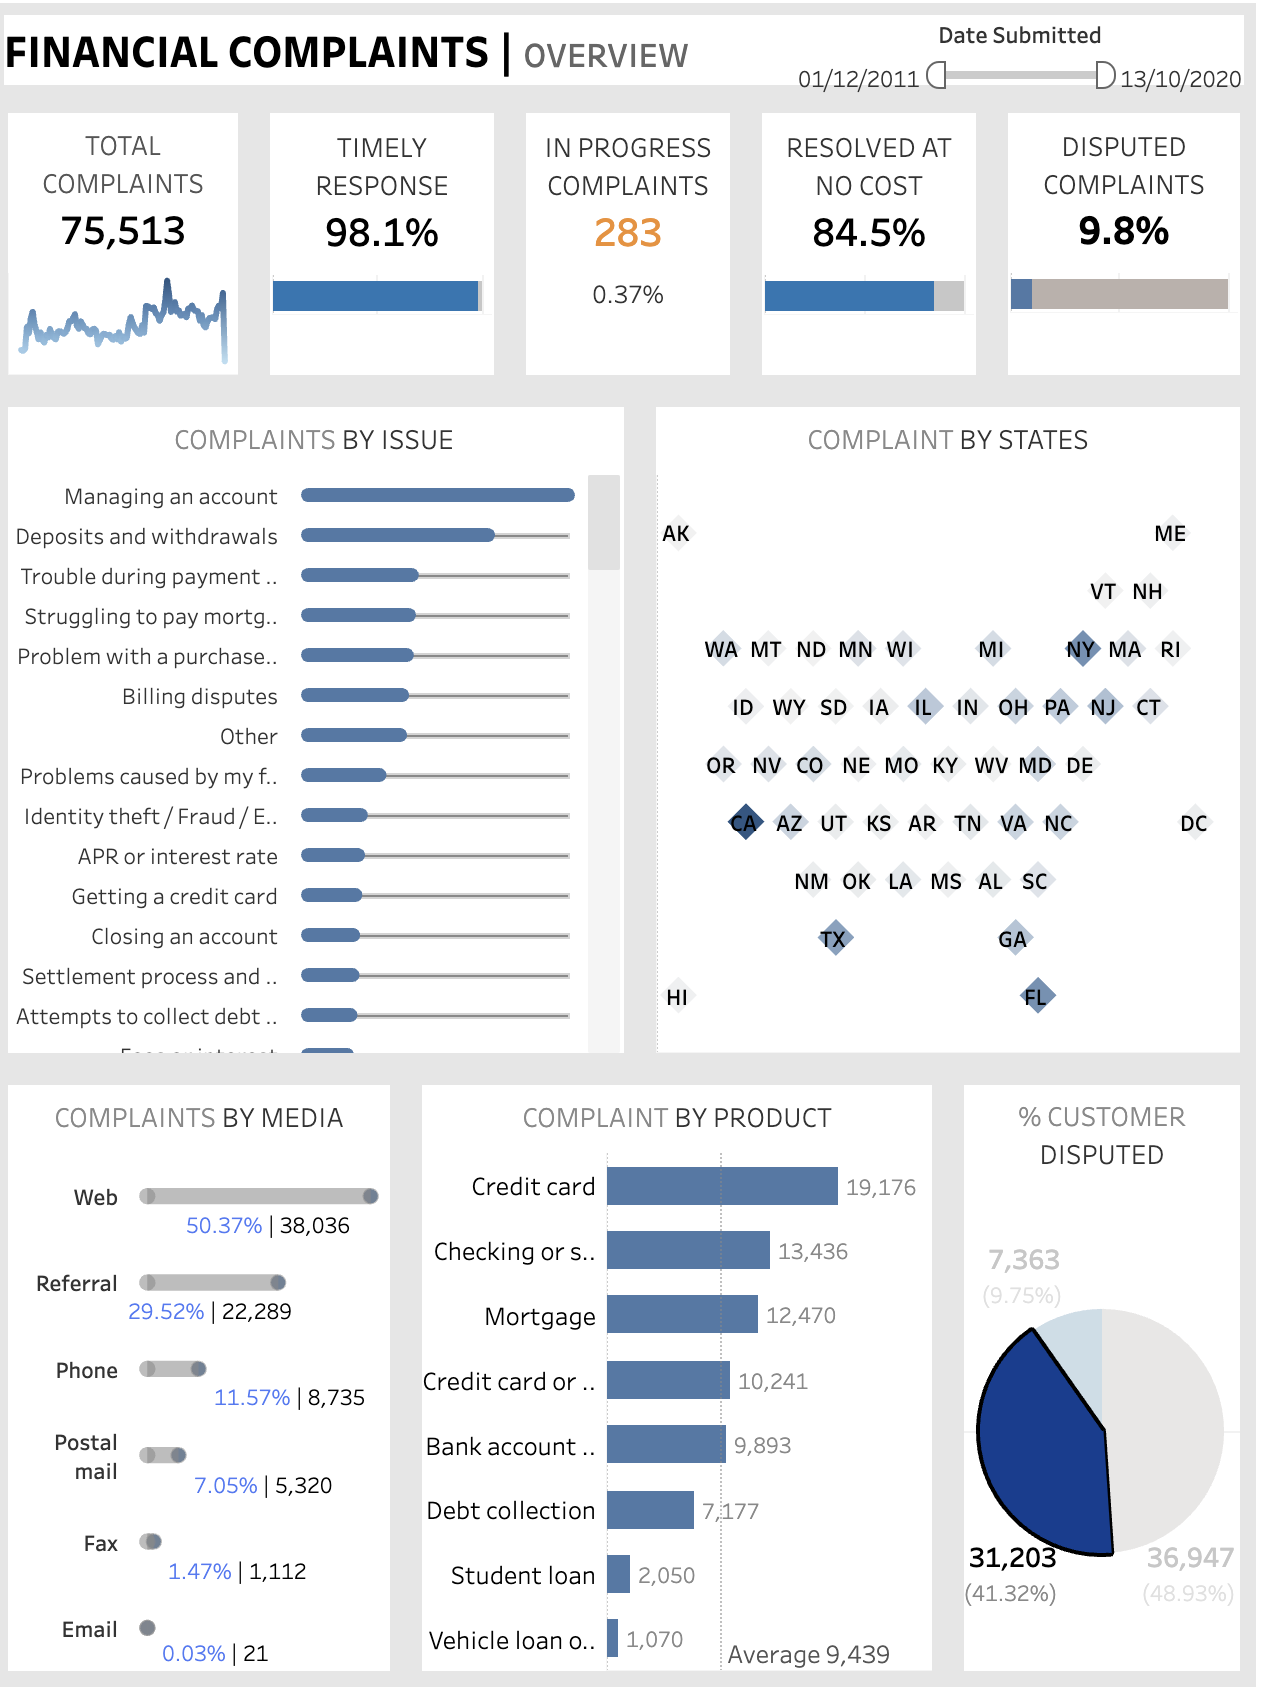
This project constructs an insightful visual representation of consumer complaints, offering an in-depth analysis of their current status, submission channels, geographical distribution, complaints by issues, and product categories that the complaint is related to. This tool assists management in understanding and addressing consumer concerns effectively.
Data Source
Tools used: Tableau
Visualization
Insights
- Most of the complaints got the timely responses with timely response rate of 98.1%. However, 2.9% of the consumers didn’t get enough responses on time.
- 0.37% of the total response are in progress.
- 84.5% of the complaints have been resolved without any cost.
- Account related issues are the main in the consumer complaints, followed by deposit/withdrawal issue and payment troubles.
- California tops the list in consumer complaints, with 12,107 complaints. After California, New York has the most complaints followed by Florida.
- Most of the submission happen via Web followed by Referral.
- Most of the complaints are about Credit card followed by Checking/saving account. Mortgage comes 3rd place when it comes to consumer complaints.
- 9.8 % of the consumers disputed when making complaints. 41.32% of the consumers didn’t dispute. 48.93% of the consumer have no information regarding dispute.