
Passenger satisfaction analysis using supervised machine learning model
Customer satisfaction plays a crucial role in determining business performance and serves as a strategic tool for gaining a competitive edge. Using machine learning models on a dataset from an American airline, this project predicts passenger satisfaction with airline services, highlighting key factors influencing satisfaction and provides actionable recommendations for enhancing customer experience across different flight categories and passenger classes.
Data Source
Data used in this study is the passenger satisfaction data set of an American airline on Kaggle https://www.kaggle.com/binaryjoker/airline-passenger-satisfaction
Exploratory data analysis
The dataset contains 129880 samples.
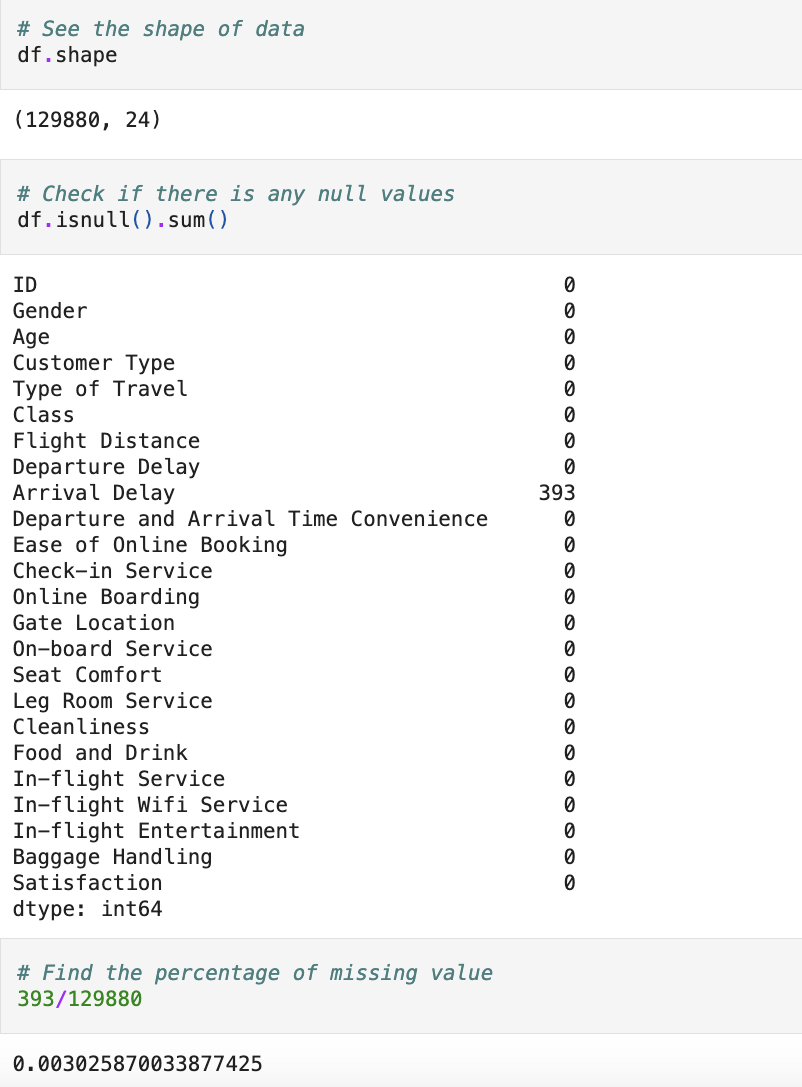
Missing Values
Initial dataset contains 0.3% of missing values. I used median method to fill the missing values.
Outliers
Outliers can have a significant impact on machine learning models, potentially skewing results or leading to inaccurate predictions. I used .describe() from Pandas to get an overview of the distribution of the numerical features.
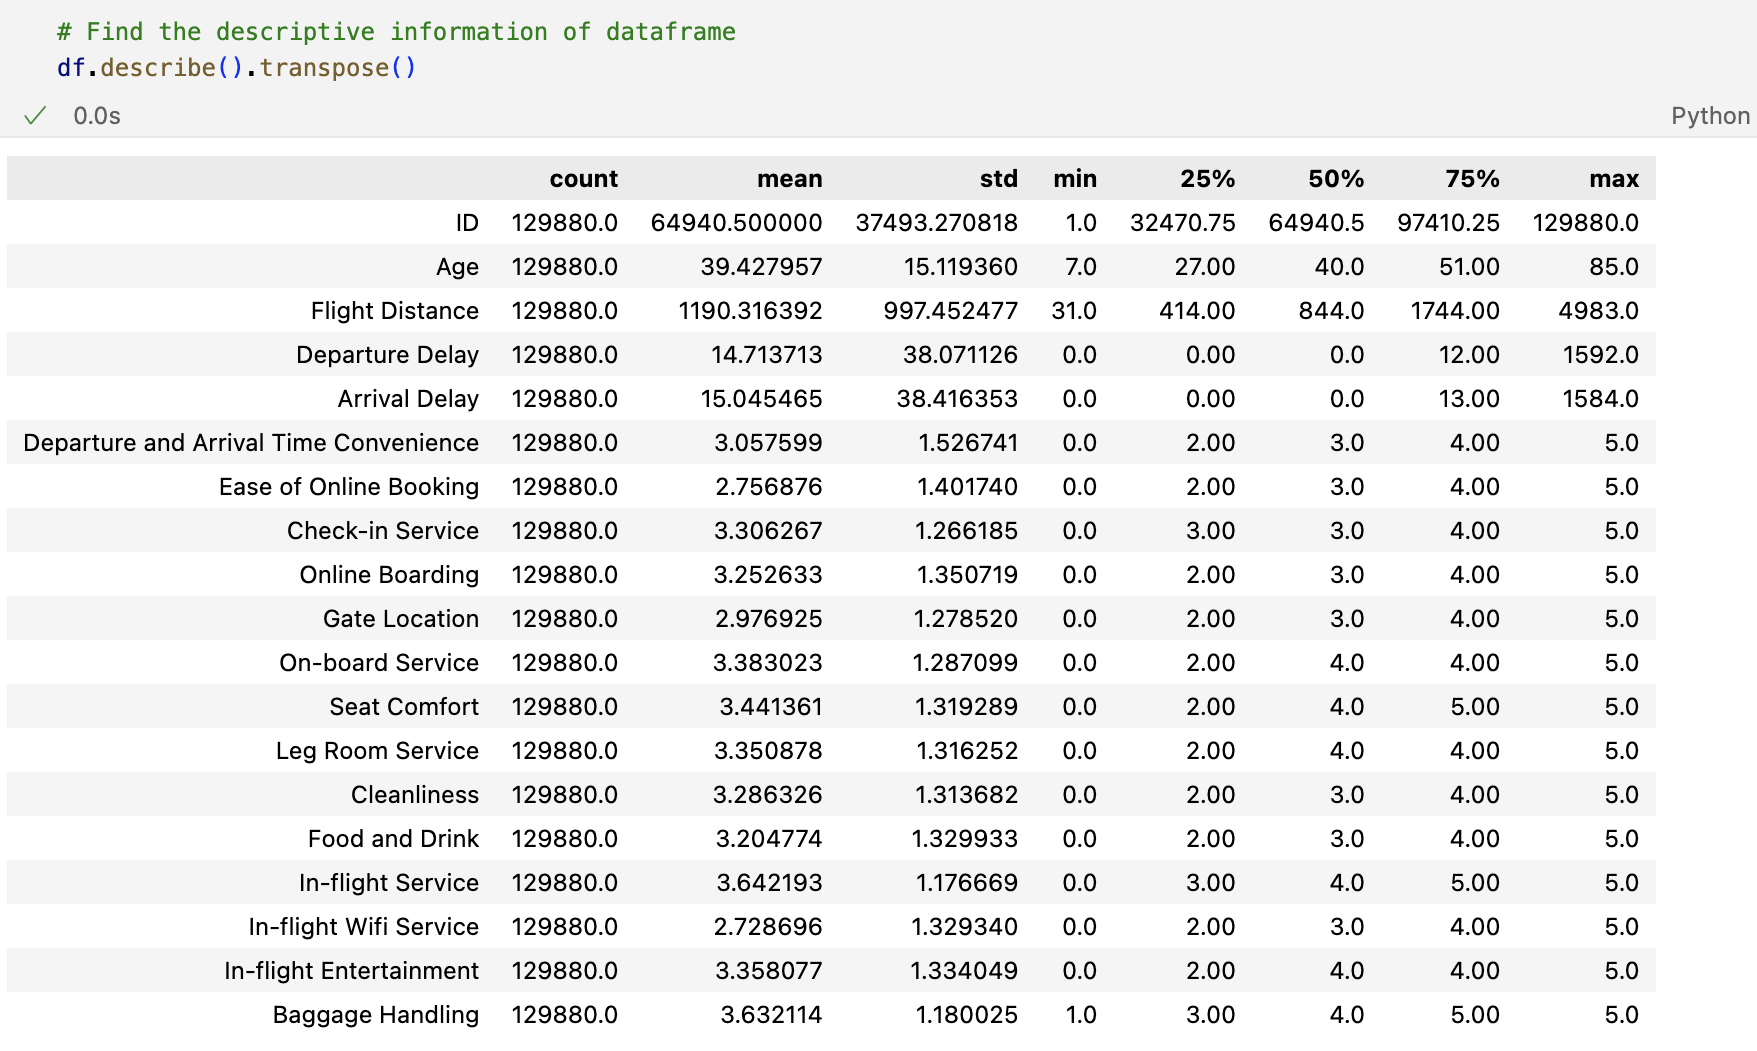
From the table above, I have observed that max column values for some variables are much higher than their median value. For example, ‘Flight Distance’ has median value of 844.0 and a max value of 4983.0.
Visualizing the outlier;
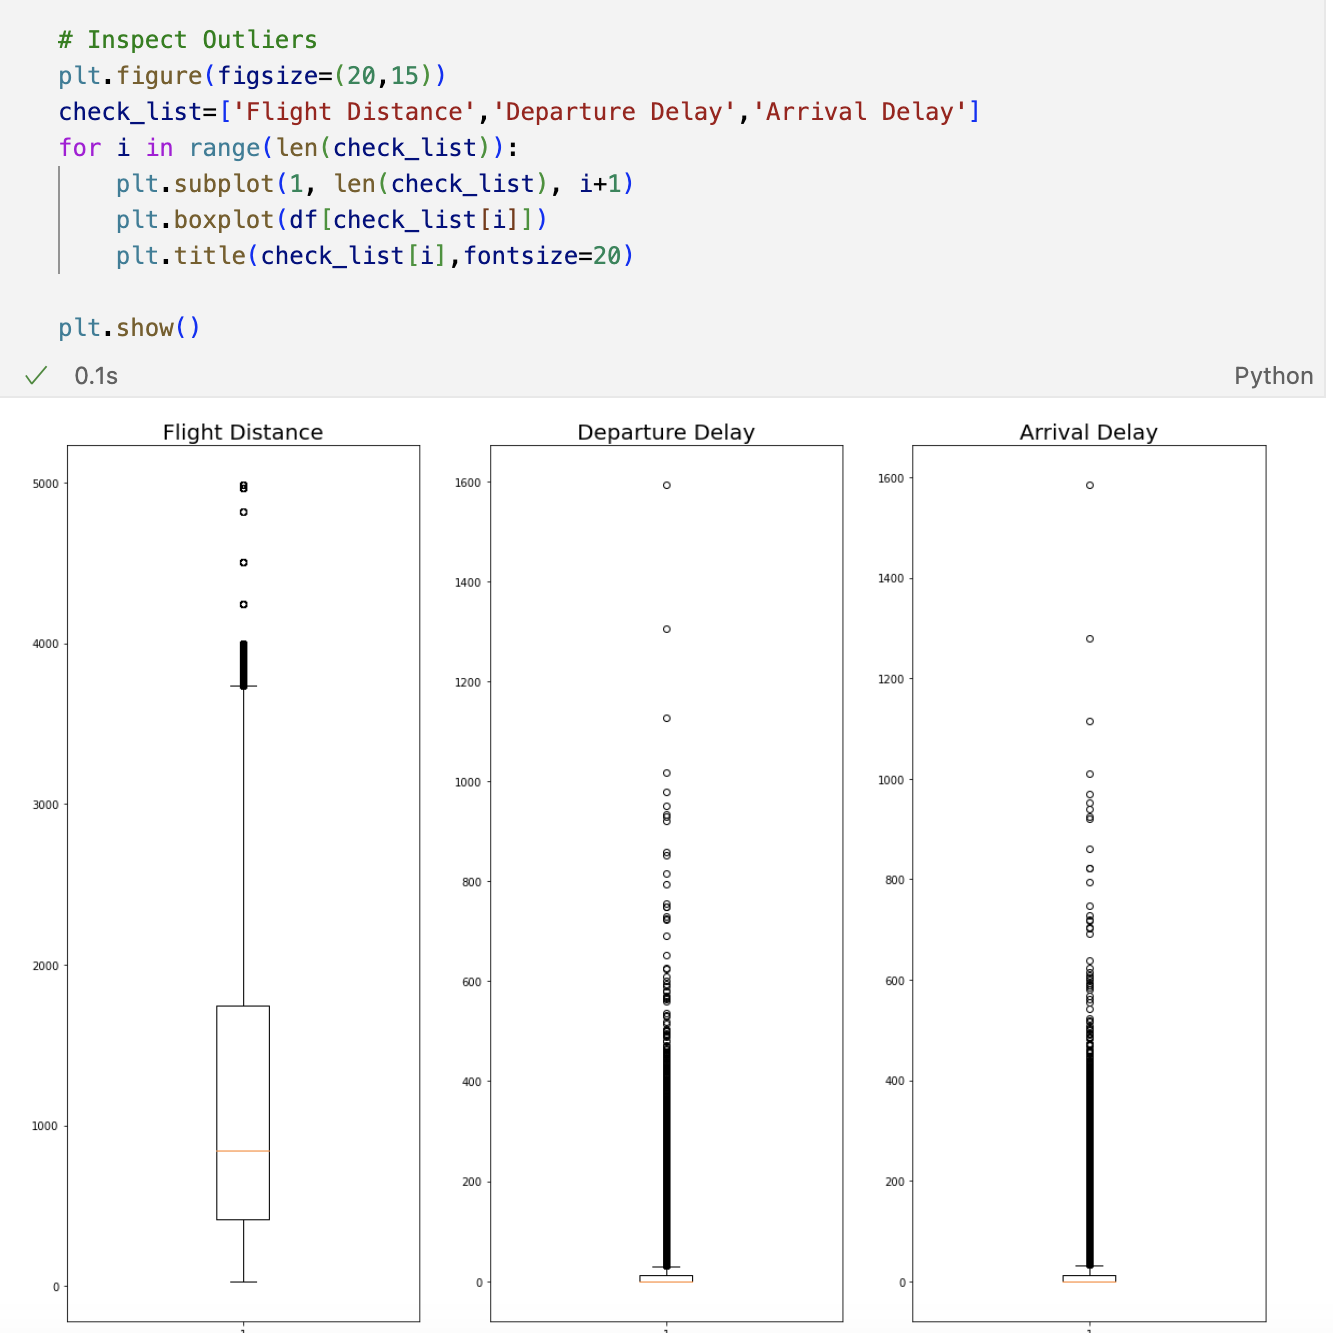
So, I have used outlier removal method on three variables ‘Flight Distance’, ‘Departure Delay’ and ‘Arrival Delay’ in order for the model to better generalize across the full dataset.
After removing the outliers, there are 105722 samples.
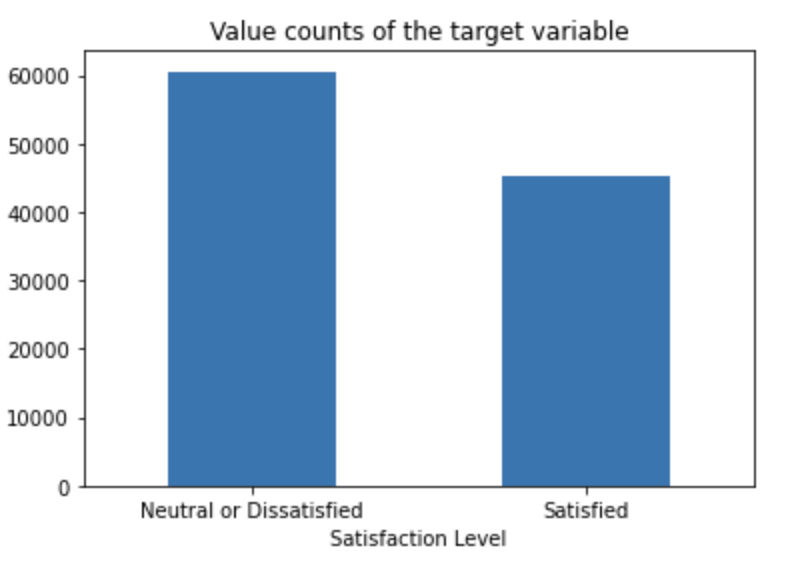
Target variable
It is a balanced dataset with 57.253% data ‘Neutral or Dissatisfied’ and 42.747% ‘Satisfied’.
Data Preprocessing
Creating bins
Binning can be a useful technique for simplifying and enhancing the interpretability of data, especially when dealing with continuous variables that have meaningful categories or thresholds. So, I have created ‘Age’ bin as ‘Minor’,’Young Adult’,’Adult’,’Elderly’ and ‘Flight Distance’ bin as ‘Short Haul’,’Medium Haul’,’Long Haul’ so that it will help to study how these variables relate to customer satisfaction.

Visualizing the bins
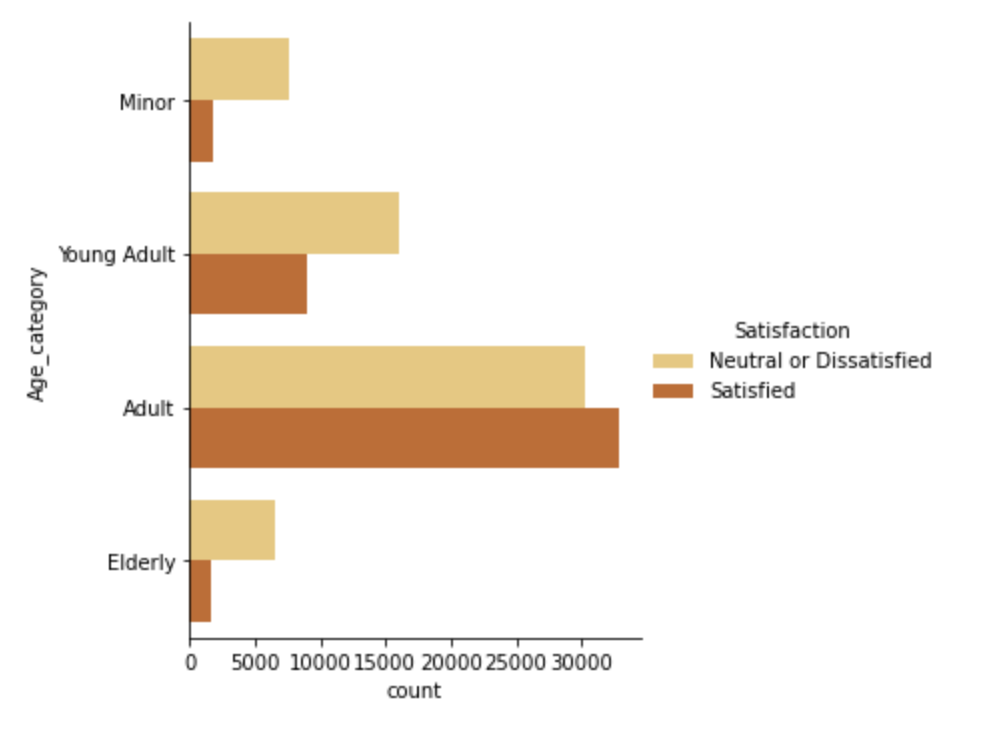 We can see that minor, young adult and elderly people are neutral or dissatisfied with the flight service whereas adult are more satisfied
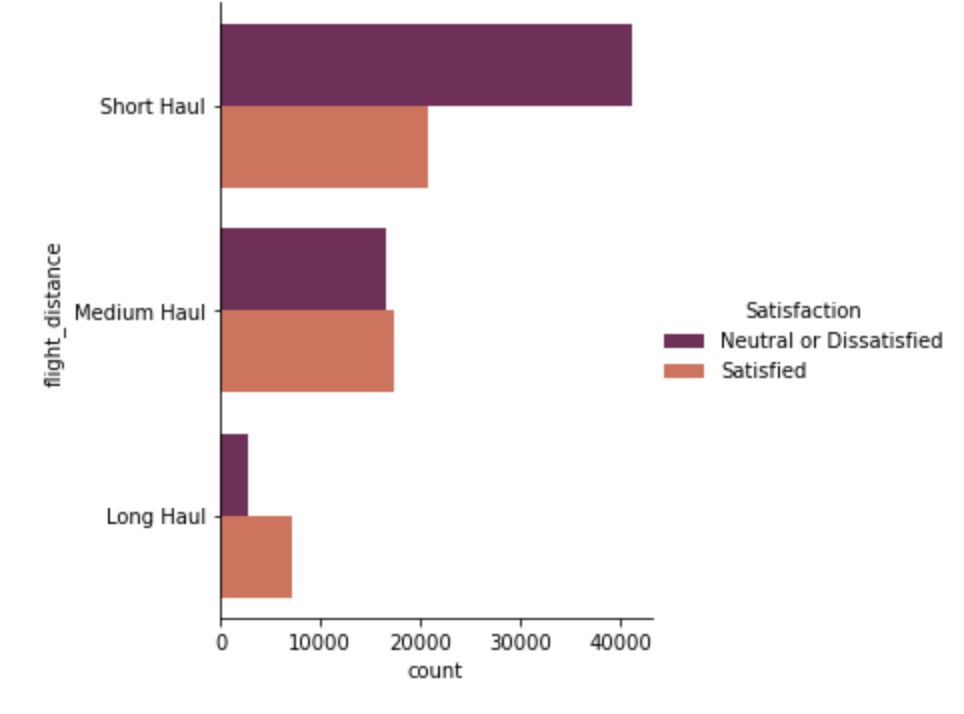 We can see that passenger in short haul flight are more dissatisfied with the flight service than medium haul and long haul flights.
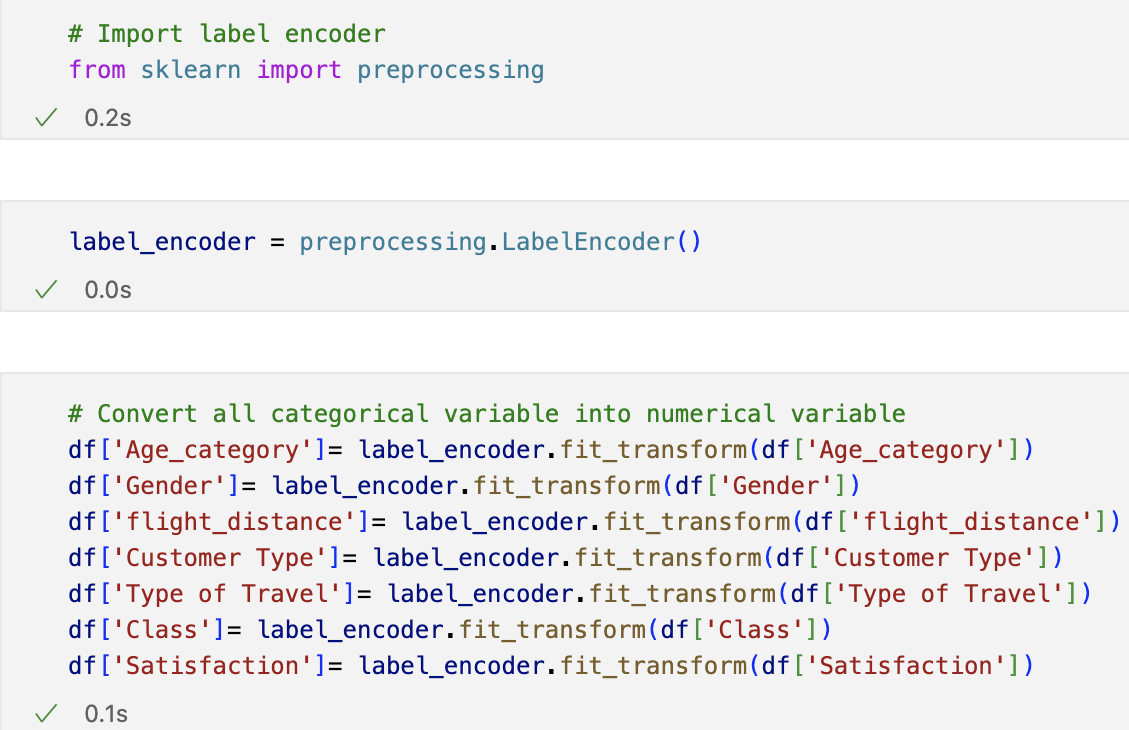
Labeling the categorical variables
I have transformed all the categorical variables in the dataset to numerical features for the processing by machine learning models using fit_transform method of label_encoder.
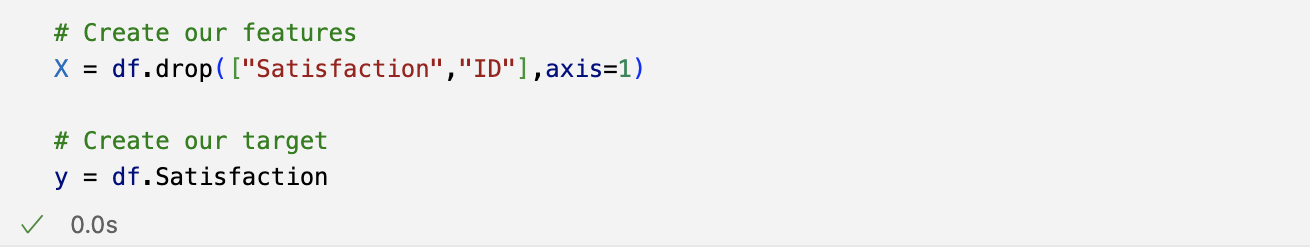
Split the dataset
In the next code block, I have split data into an X which contains only the predictors i.e. independent variables, and a y object that contains only our target i.e. dependent variable.
Then, I have split the dataset into training and testing sets, with 80% of the data allocated for training and 20% for testing

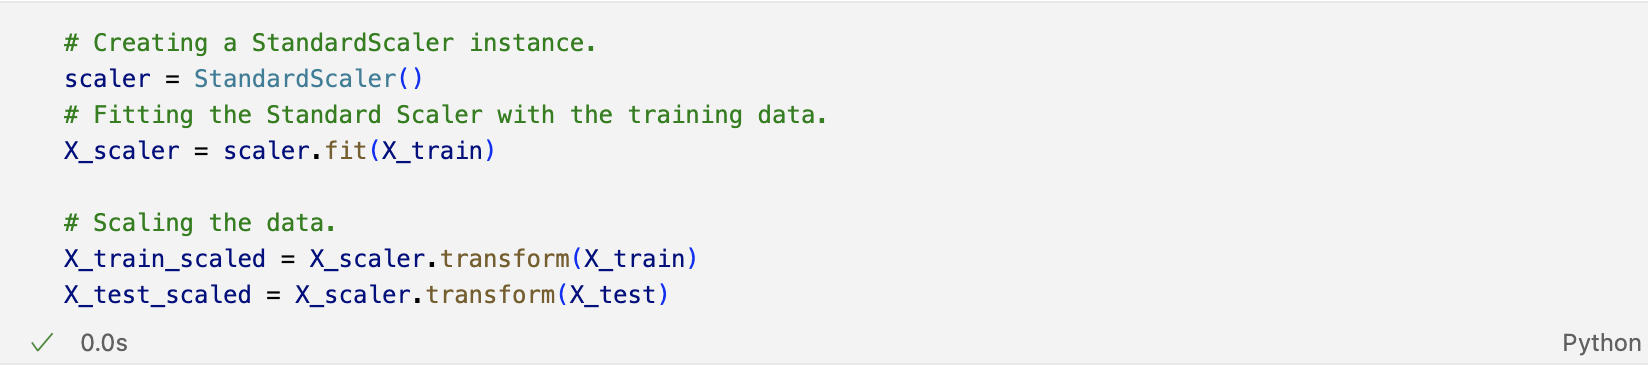
Feature scaling
I have used ‘StandardScaler’ to ensure that both training and test datasets are scaled so that all features contribute equally to the model fitting process and present features with larger scales from dominating the learning process.
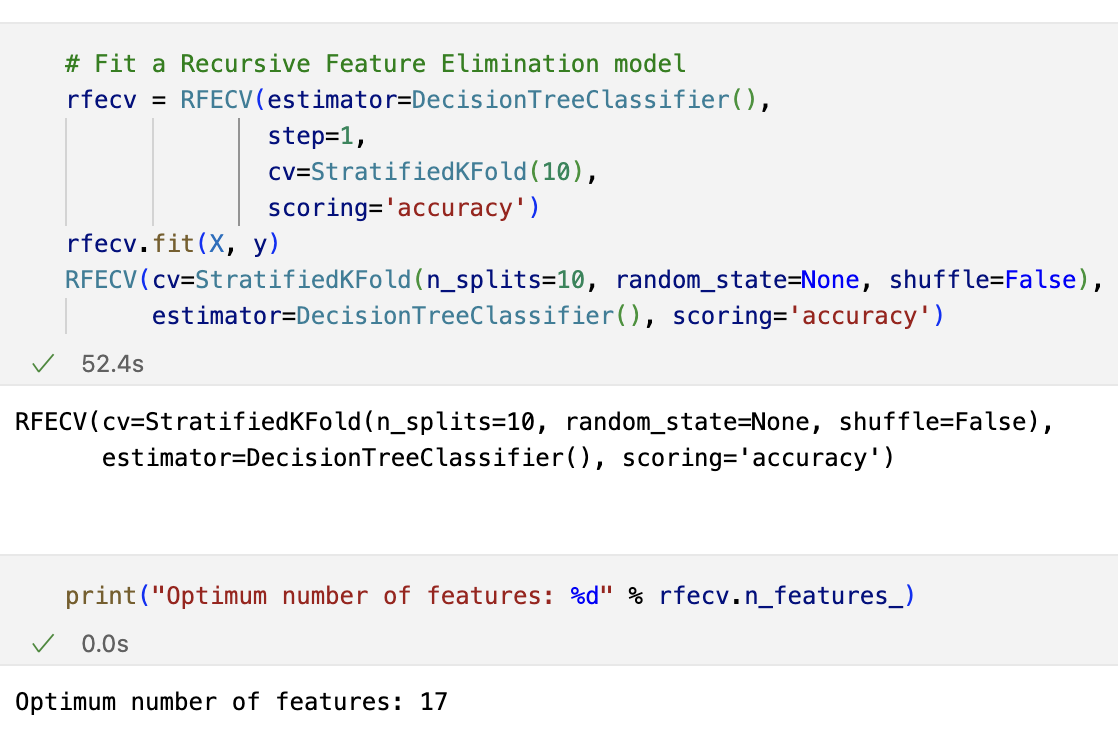
Feature Selection
The RFECV() feature selection tool is employed to determine the ideal number of features for maximizing the accuracy score in our model. RFE, a widely-used feature selection technique, iteratively removes features from the dataset based on their significance until reaching the optimal feature set.
Visualizing the feature Vs accuracy chart
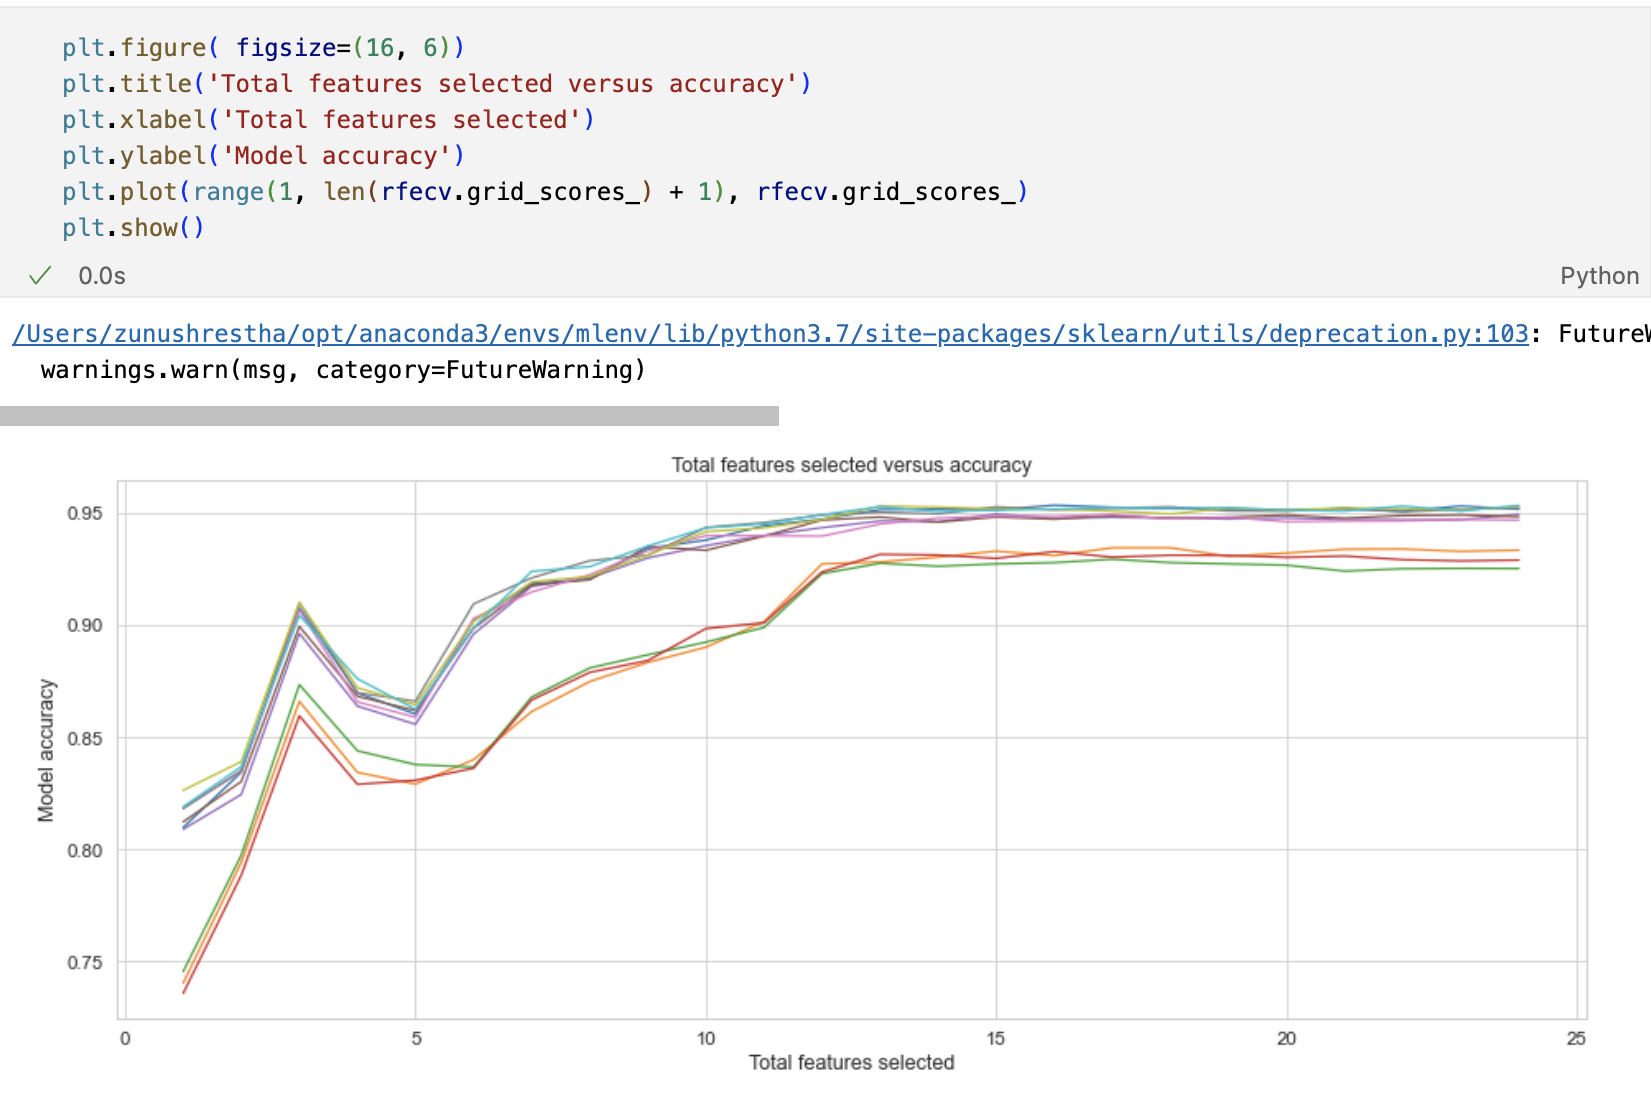
The number of features with the highest accuracy is 17.
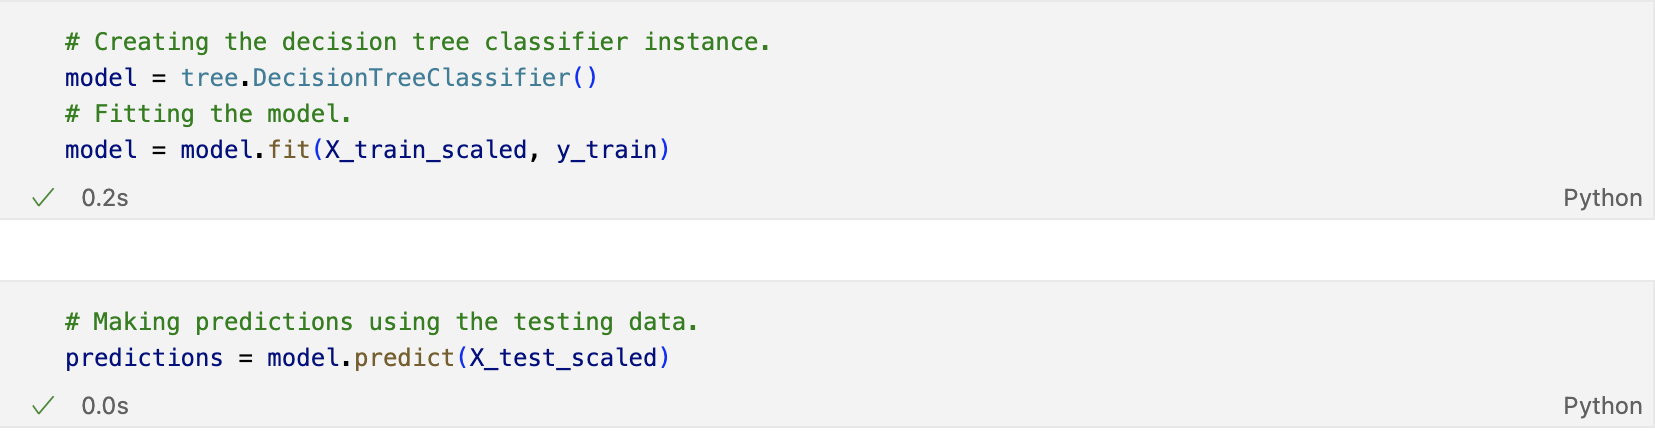
Model Training
The following code block creates an instance of the Decision Tree Classifier from scikit-learn, and then fits the model to the scaled training data.
Confusion matrix
The evaluation of the decision tree classification model on the testing data is visualized as below;
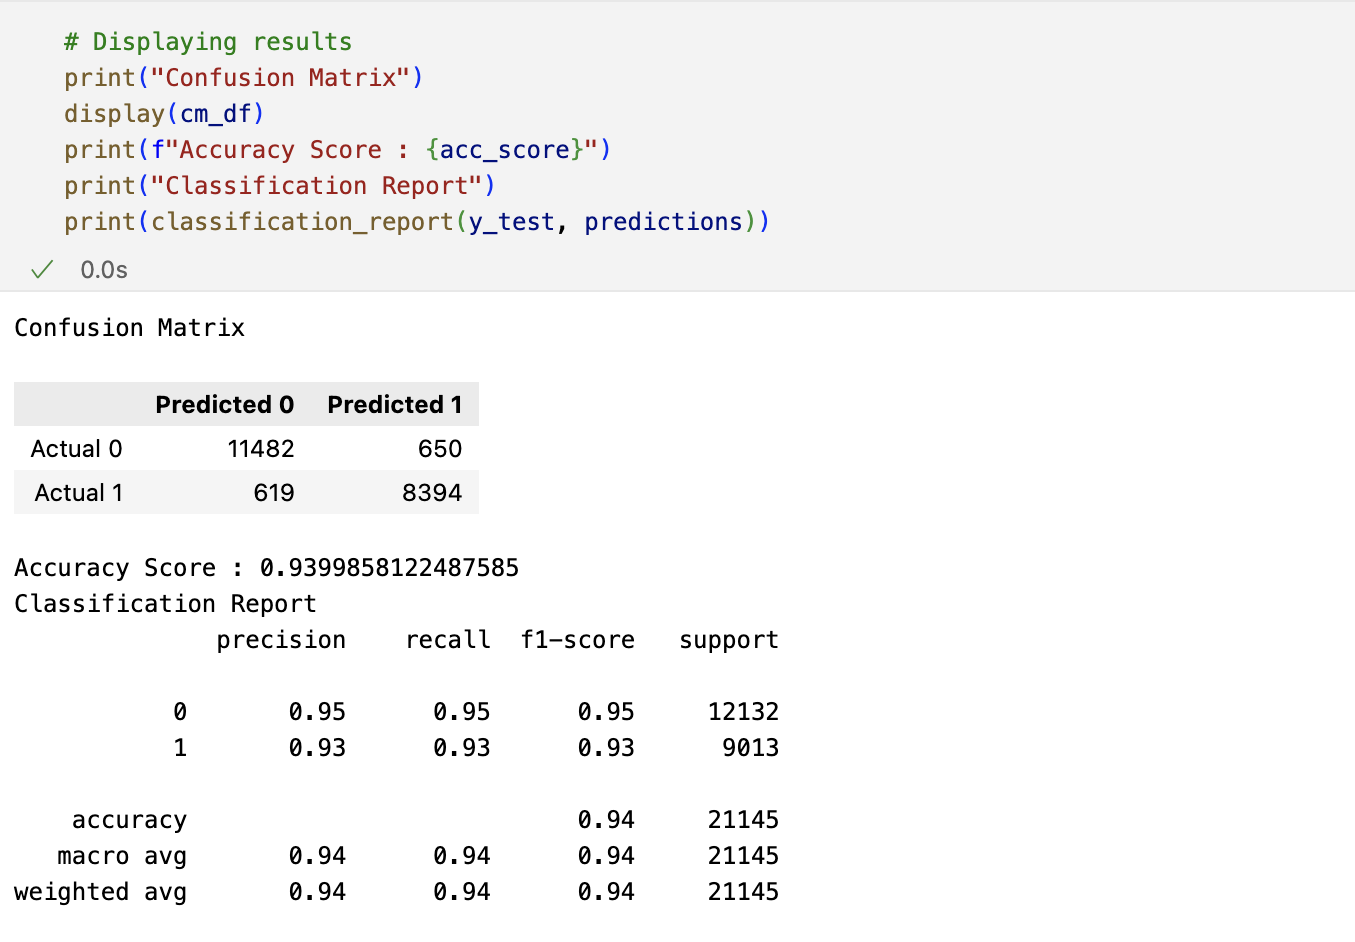
Accuracy Score: It indicates the proportion of correctly classified instances out of the total instances. In this case, it’s approximately 94%, meaning 94% of the predictions were correct.
Precision: It measures the proportion of true positive predictions among all positive predictions. A precision score of 0.95 for class 0 and 0.93 for class 1 indicates that 95% and 93% of the predicted positive instances for each class were correct, respectively.
Recall (Sensitivity): It measures the proportion of true positive instances that were correctly identified. A recall score of 0.95 for class 0 and 0.93 for class 1 indicates that 95% and 93% of the actual positive instances for each class were correctly classified, respectively.
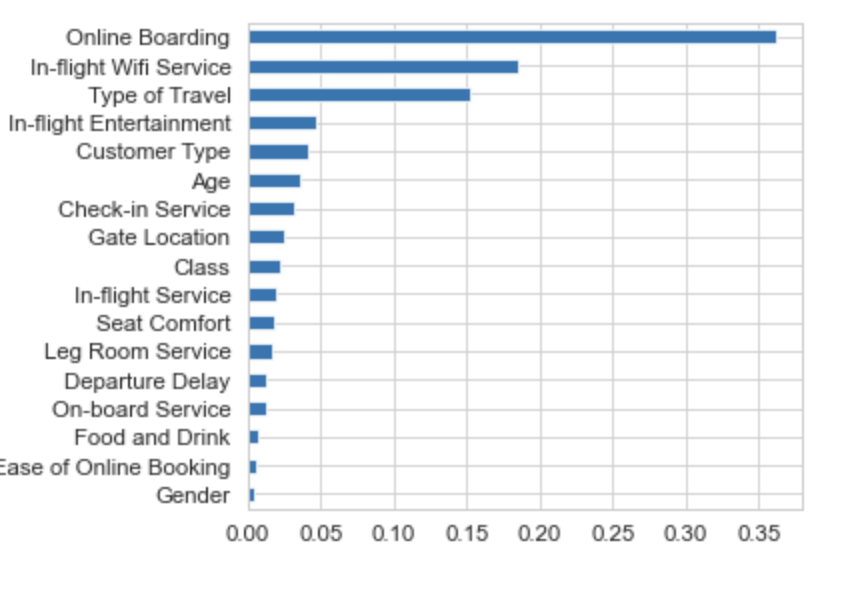
Feature importance
Finally, I want to see the contribution of each feature to the model’s predictions. Features with higher importance scores are more influential in the model’s decision-making process.
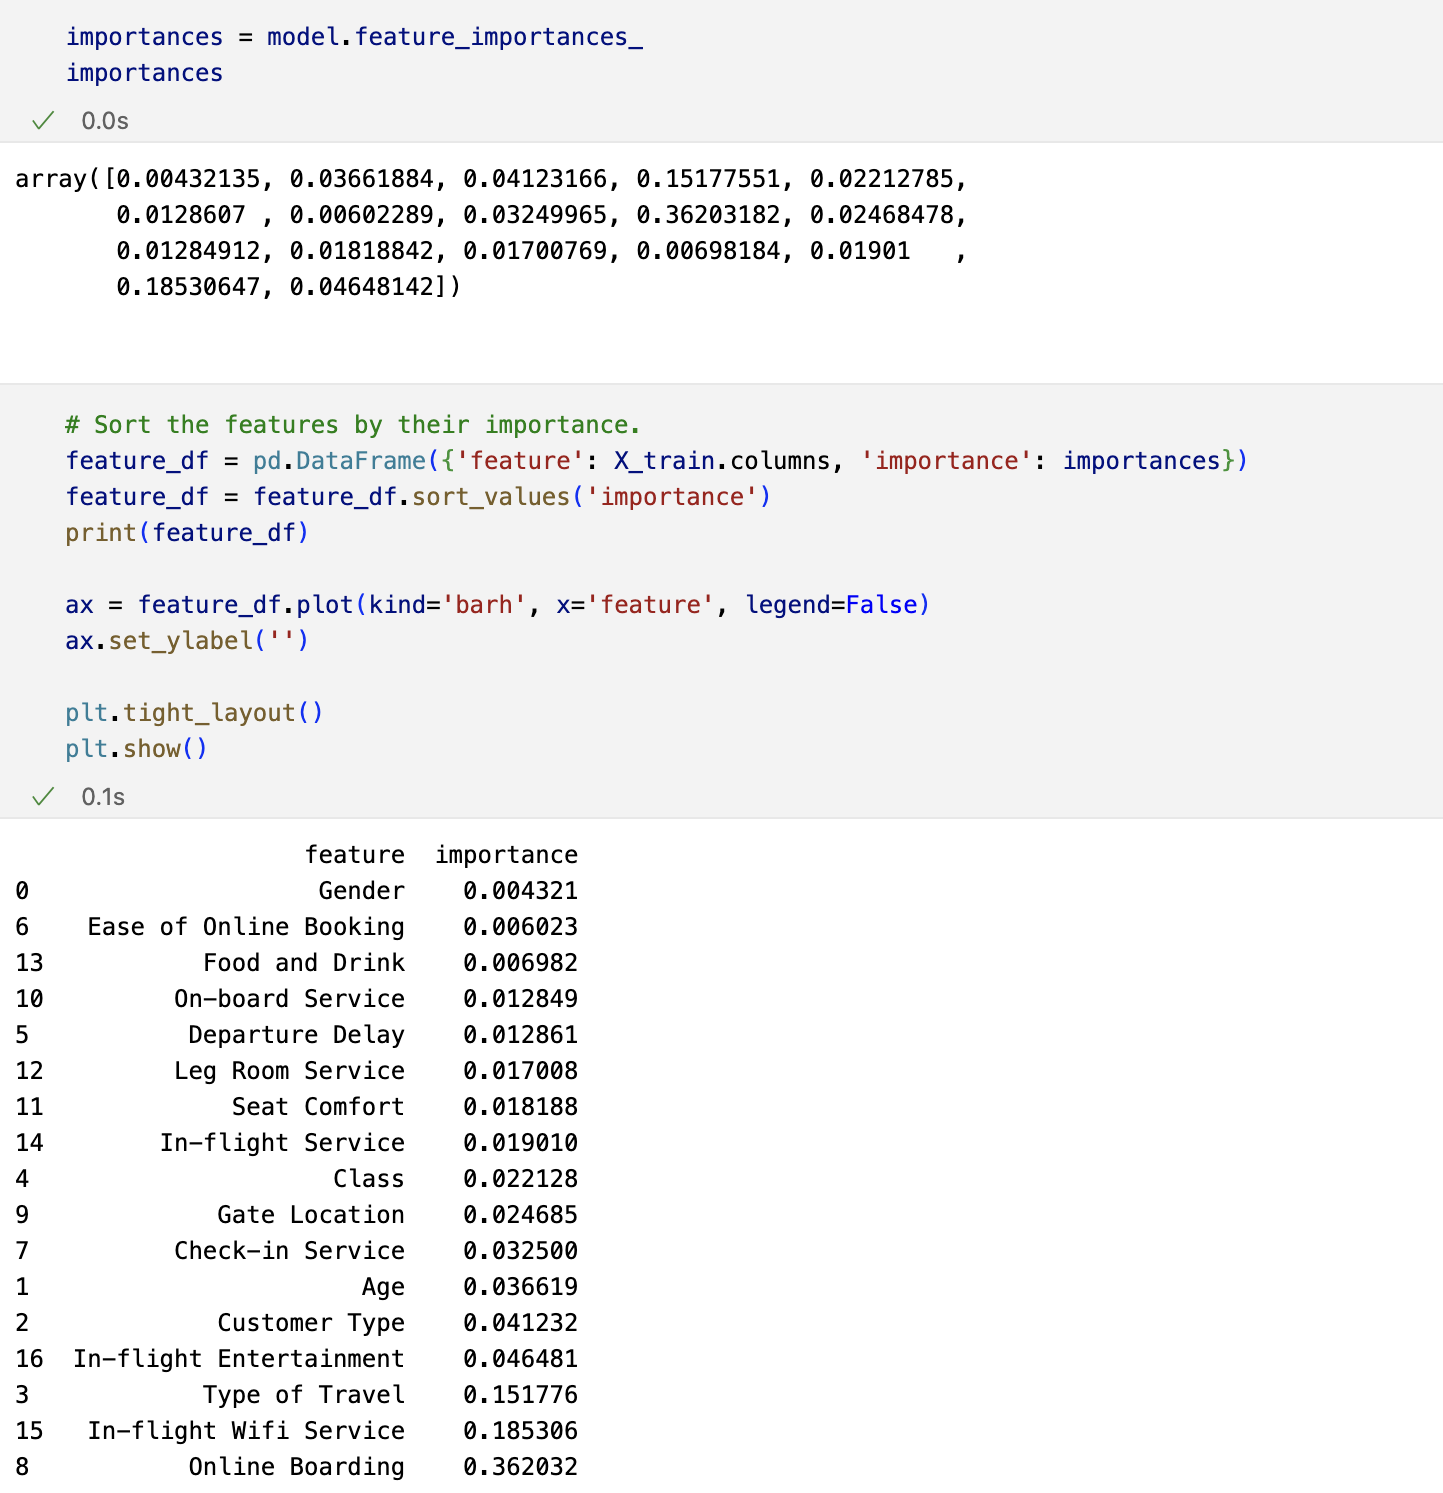
In this case, “Online Boarding” has the highest importance score (0.362032), indicating that it contributes the most to the model’s predictions. Conversely, features with lower importance scores are less influential. For instance, “Gender” has a very low importance score (0.004321), suggesting it has minimal impact on the model’s predictions.
Some Business insights
- Short haul passenger have higher returning rate of 54.53% than in medium haul flights (34.17%) followed by long haul flights (11.28%) however the passenger in short haul flight are more dissatisfied with the flight service than medium haul and long haul flights
- Business class passenger are more satisfied with the flight service whereas economy class passenger are highly dissatisfied followed by Economy Plus class passenger. Further, business class passenger are more loyal than other class passenger.
- Young adult and elderly people are neutral or dissatisfied with the flight service whereas adult are more satisfied. Adult are more likely to return than passenger of other age groups.
- Online boarding has the most significant impact on satisfaction, closely followed by in-flight wifi service and in-flight entertainment. Similarly, demographic factors such as customer type and age also have significant influence on satisfaction levels. Therefore, airlines should tailor their services to target these specific customer demographics.
Recommendations
Enhanced Service for Short Haul Flights: Although short haul flights generate higher revenue, they have higher dissatisfaction rates. The airline should prioritize improving service quality specifically for these flights, addressing the factors that contribute to dissatisfaction.
Improved Economy Class Experience: Since economy class passengers express dissatisfaction, the airline should focus on enhancing their experience. This could include improving seat comfort, enhancing in-flight entertainment, and providing attentive customer service.
Premium Class Maintenance and Promotion: Business class passengers have higher satisfaction and loyalty, so the airline should maintain and promote the quality of premium class offerings. This includes ensuring comfortable seats, exclusive amenities, and personalized service.